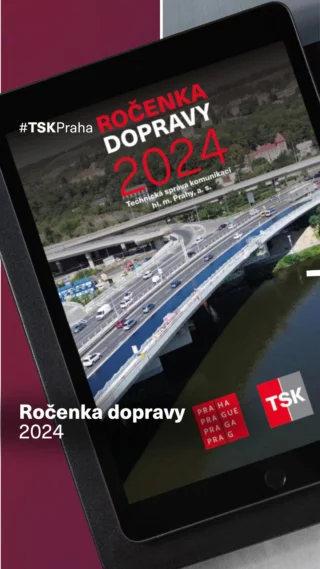
2
IMPACT OF CORONA CRISIS ON TRANSPORT IN PRAGUE

Since March of 2020, the whole world has been having to deal with the pandemic of SARS CoV-2. In the Czech Republic the disease was particularly felt in the spring and autumn months. In an attempt to mitigate the consequences of the disease and prevent hospitals from being overwhelmed, the government gradually introduced measures starting in March, with the exception of the summer holidays and the start of September, continuing until December, which resulted in changes to the transport behaviour of inhabitants. Over the course of the whole year, the City of Prague Technical Administration of Roads monitored the development of transport in the capital. It analysed both automobile traffic – the progression of traffic volume at selected profiles on the Prague road network, the behaviour of traffic flow and accident rates – and bicycle traffic, where it monitored cyclist volumes at permanent counter stations, as well as determining public transport developments from Prague Public Transport Company data.

Automobile traffic saw its most marked drop of roughly 30 % in the spring. Around the summer holidays, during which individual restrictions were eased, it reached nearly standard levels (compared to data from 2019) and in the autumn months, when the public health situation in the Czech Republic deteriorated again, automobile traffic in Prague ranged around 85 % to 90 % of its standard state.

Comparison of automobile transport development during selected work weeks in 2020

graf 1.png

It is evident that the monitored indicators changed over the course of the year in direct correlation to the level of government restrictions in place.

Changes in traffic behaviour over the course of the day are documented by what is called the “daily variation”, which shows the percentage distribution of the traffic load on the whole Prague road network over the course of an average workday, thus depicting the periods when the transport network is under the greatest pressure.

Comparison of daily variation in automobile traffic in 2019 and 2020 – total vehicles

graf 2.png

It is apparent from a year-on-year comparison of the average daily variation in 2019 and 2020 that the majority of trips by automobile during 2020 were carried out during the daytime (from approx. 5:00 to 19:00). This change is due to the fact that one of the government measures applied during the spring, autumn and end of the year was a night-time curfew, only exempting trips to and from work. For this reason, as well as with regard to the reduced number of trips taken by taxi due to the limited opening hours of restaurants and nightclubs during the government restrictions and the overall marked drop in tourism in the capital, there was a lower number of trips by automobile during the night-time, as is evident from a year-on-year comparison of the daily variation.

The decline in traffic during the night-time was even more pronounced in the daily variation of slow vehicles, i.e. vehicles with a maximum permissible weight of over 3.5 tonnes.

Comparison of daily variation of automobile traffic in 2019 and 2020 – slow vehicles

graf 3.png

Alongside automobile traffic, the development of bicycle traffic was also monitored during 2020.

Year-on-year comparison of bicycle traffic development in 2019 and 2020 (weekly volume)

graf 5.png

More than any other type of transport, bicycle transport is dependent on the weather. A year-on-year comparison shows that there was an overall increase in bicycle traffic volume in 2020. In all likelihood, this rise is closely tied to the situation at the time, which forced many people to use a bicycle as an alternative to public transport, as well as the use of a bicycle as a possible replacement for other types of cancelled sports activities.

Changes in the transport behaviour of the capital's inhabitants in 2020 can be observed in the development of the modal split. The last comprehensive assessment of the set of transport-sociological surveys was produced in 2016 and comprised a balance of all trips within the territory of the City of Prague, i.e. intra-urban trips, plus external trips, i.e. trips into or out of the city, as well as transit trips, both by inhabitants of Prague and visitors to the capital. Unfortunately, a similar set of studies could not be conducted to the same detail in 2020, thus only the available source materials were used to calculate the modal split in 2020, primarily changes to traffic volume recorded by automatic counters.

Development of modal split (MT/IAT – mass transport/individual automobile transport)

graf 6.png
Prague Transportation Yearbook 2020 ― Chapter 2